

Your hiring budget probably looks tidy on paper and messy everywhere else. Finance sees invoices, recruiting sees chaos, and the business just sees roles that stay open long enough to become a problem. That's exactly why cost per hire analysis matters, it turns the mushy “we think hiring is expensive” conversation into a number you can tackle.
The catch is simple. Teams stop at the headline formula, then wonder why the metric doesn't change behavior. It's because the number is only useful when the scope is consistent, the cohort is clean, and the hidden labor isn't being swept under the rug like last quarter's office snacks.
Three senior roles sit open. Recruiters are sprinting, hiring managers are grumbling, and every week the seats stay empty, another chunk of revenue disappears into the void. Nobody books that as a line item, which is exactly why hiring gets treated like background noise until the budget review turns ugly.
The worst part is that leaders often blame the obvious stuff, agency fees, search retainers, job ads, maybe an overworked recruiter who's one coffee away from mutiny. Those things matter, but they're not the whole bill. Cost per hire analysis is the diagnostic that tells you whether the recruiting engine is doing its job or just making expensive noises.
SHRM's 2025 benchmarking data put the U.S. average cost per hire at about $4,700, up from $4,129 in the prior cycle, which is roughly a 14% increase year over year, according to the benchmarking summary from iCIMS. That number is useful, but only if you treat it as a signal, not a trophy. A “good” cost per hire with sloppy scope is just theater with a spreadsheet.
Practical rule: if the definition of a hire changes midstream, your trend line is junk. Don't benchmark vibes.
That's where many teams fumble. They celebrate a lower number after excluding onboarding, hiring-manager time, or other real costs, then act surprised when the business still feels expensive. If you want the ugly truth about bad hiring decisions bleeding the business, read the cost of a bad hire and then come back with a straighter face.
The point isn't to make the number look dramatic. The point is to make it honest enough to act on.
The SHRM formula is almost insultingly simple, which is why so many teams manage to get it wrong. Internal recruiting costs + external recruiting costs, divided by total hires. That's the whole thing, and yet half the industry behaves like it requires a priest, a whiteboard, and a three-week alignment workshop.
First, lock the time window. Quarterly is usually the sanest choice, because it gives you enough volume to matter without waiting forever to find out you're bleeding cash. Then define what counts as a hire and keep that definition fixed. Internal transfers, contractor conversions, and backfills all need a rule, because moving the goalposts midyear is how teams fake improvement without meaning to.
Use the actual recruiting cost stack. That means recruiter salaries or allocated labor, ATS subscriptions, assessment tools, agency invoices, referral payouts, and other external recruiting spend. If you're trying to get decision-grade rigor, the logic used in getting decision-grade metrics is a decent mirror, because the discipline is the same, count all the costs, not the convenient ones.
A mid-sized startup that hires 24 people in a quarter needs the same discipline, just at smaller scale. The owner of each line item matters, because if no one owns the cost, finance will eventually ask why it existed in the first place. That's when the meeting gets awkward, and it should.
Short version: if your cost per hire can't be recomputed by another operator from the same inputs, it's not a metric, it's a memo.
SHRM also separates executive and nonexecutive hiring, and that split is the part people love to ignore until they're hiring a VP. In 2026, the median cost per hire for executive positions was $15,000, compared with $1,300 for nonexecutive positions. That gap is the whole story, seniority changes the economics, and pretending otherwise is how lazy benchmarking spreads.
If you want a simple way to run the math without turning every quarter into a forensic audit, use this cost per hire calculator as a sanity check, then bring the outputs back into your own model.
If your model only counts invoices, you're not measuring cost per hire, you're measuring the easy bits. That's fine for a rough sketch, but useless if you want to know where the money goes. The bill has layers, and the annoying part is that the messiest layer is usually the one everybody wants to leave out.
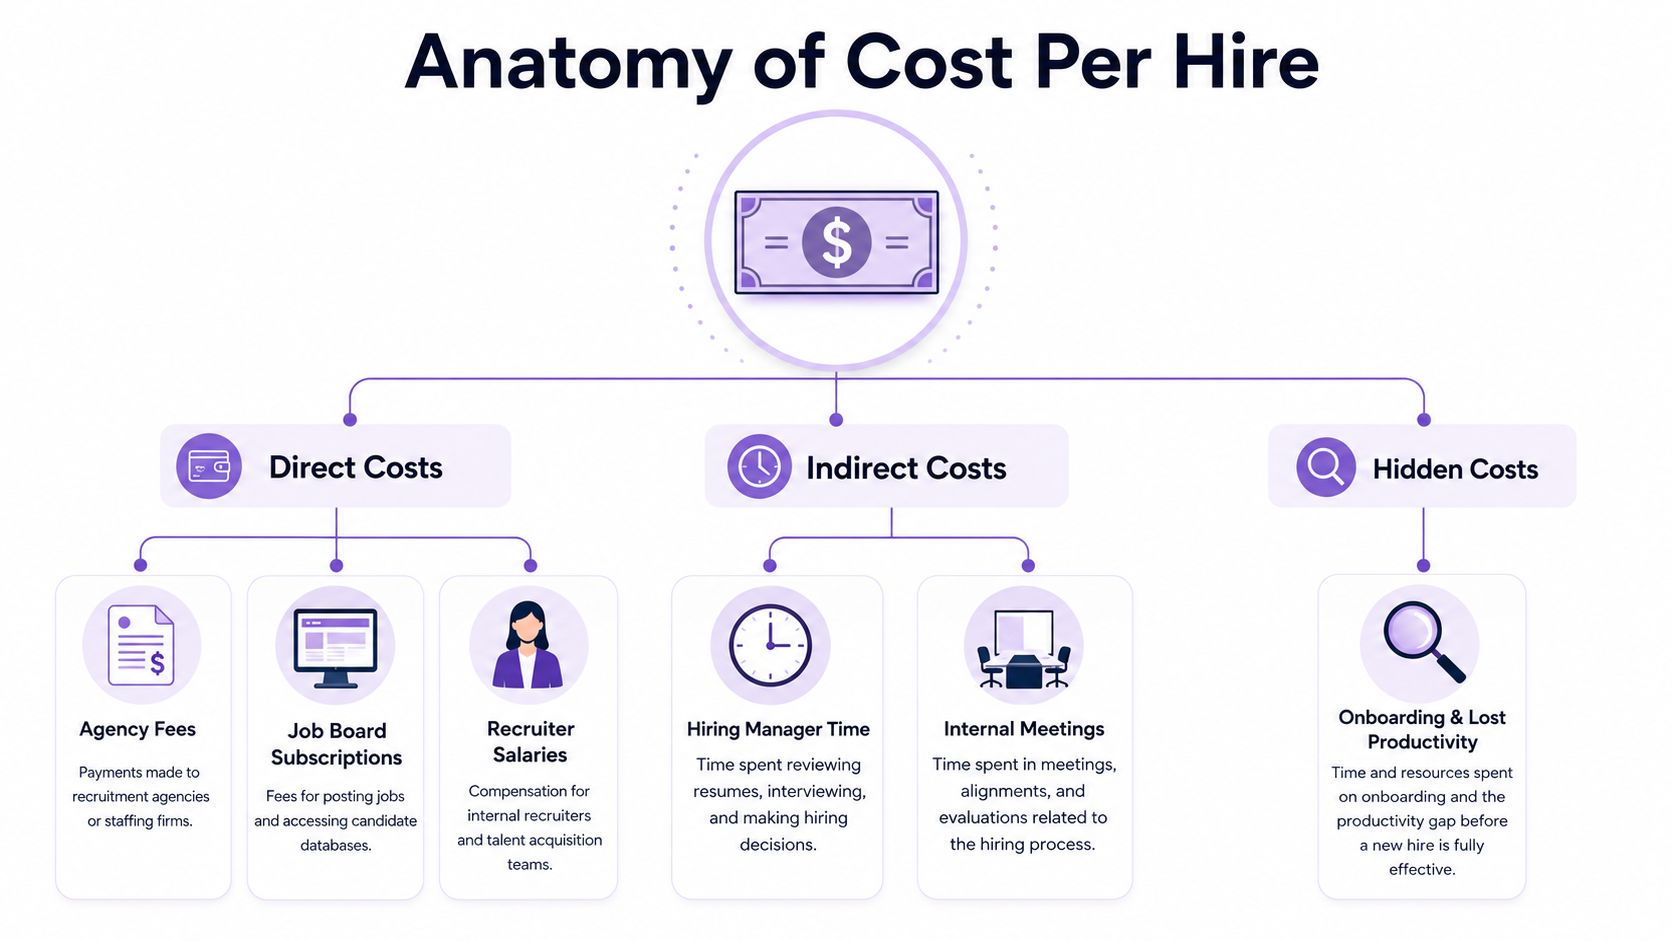
Direct costs are the obvious ones. Agency fees, job board subscriptions, recruiter salaries, referral bonuses, assessment licenses, and verification tools belong there. They show up in the stack because someone paid them on purpose.
Indirect costs are sneakier. Hiring-manager time, interview panel hours, onboarding support, and workspace provisioning don't always arrive as neat vendor invoices, but they still cost money. If you ignore paid labor from the rest of the company, you're basically telling yourself that everyone's time is free, which is adorable and false.
Hidden costs are where the damage hides. Vacancy loss, delayed projects, relocation, immigration fees, and productivity drag during ramp-up all belong in the conversation when you want the complete picture. A tidy headline number can look better on slide eight, but it can also lie to your face while the role stays open.
One 2026 benchmarking breakdown estimated that 57% of cost per hire comes from recruiter time, internal labor, and sourcing channel spend, 30% from the technology stack, assessments, and verifications, and 13% from candidate experience and onboarding, according to the benchmark summary from GetRaffi. That split matters because it shows the cost isn't sitting in one obvious place. It's spread across labor, tooling, and process friction.
Useful framing: lower reported cost per hire isn't always efficiency. Sometimes it's just accounting with better posture.
Teams get tempted to “clean up” the metric by excluding hard-to-measure items. Bad move. If you strip out onboarding, vacancy drag, or internal labor, you don't create savings, you create false efficiency. The better move is to standardize the taxonomy internally so finance, recruiting, and hiring managers all use the same buckets, then compare quarter to quarter without changing the rules.
A single blended number is a blunt object. It tells you something, but not enough to make budget decisions without guessing. If you want to know which sourcing path is bloated, which role family is expensive, and which recruiter motion is burning cash, you need a cohort model.
Start with start date as the financial anchor. Map each spend line item to requisitions or hires, then allocate shared costs like platform licenses and brand spend using a sensible driver, such as applications, hires, or requisitions opened. If a cost touches more than one hire, prorate it instead of dumping it on the loudest requisition in the room. That's how finance people stay calm, more or less.
Monetize recruiter and hiring-manager labor using hours worked multiplied by loaded rates. That's the part teams skip when they're rushing to defend a budget line, and it's also the part that usually explains why the model feels artificially cheap. A cohort basis lets you segment by job family, level, market, and source channel without averaging away the differences that matter.
Channel CPH is where the cut decisions get real. Compare spend against cost per qualified applicant and cost per interview, not just against raw applicant volume. A channel that looks cheap but brings junk is expensive in disguise, because it drags the funnel and eats panel time like it pays rent.
| Channel-Level Cost-Per-Hire Diagnostic | Spend (Q) | Hires | CPH | Cost per Qualified Applicant | Offer Accept Rate |
|---|---|---|---|---|---|
| Direct sourcing | Lower spend, higher control | Healthy hire mix | Strong when pipeline quality is tight | Usually cleaner | Better when targeting is sharp |
| Agency | Higher spend, fast access | Works for scarce roles | Often steep | Can be acceptable if quality is high | Often acceptable for urgent roles |
| Employee referrals | Modest spend | Fewer but often stronger | Usually efficient | Often efficient | Tends to outperform broad outbound |
| Paid job boards | Variable spend | Volume-heavy | Can look cheap until quality drops | Often noisy | Weak when screening is sloppy |
If you want a practical operating model for the numbers behind that table, the tooling pattern in recruitment analytics is worth copying, because the win is connecting spend to downstream funnel quality, not just counting applications like a hall monitor.
A common mistake is averaging across all roles and then acting surprised when specialist hiring looks “bad.” Scarce-market roles can carry higher cost per hire and still be the smarter trade if they shorten time-to-hire or prevent a critical revenue delay. Cheap isn't cheap if it keeps you stuck.
Benchmarks are useful until people start using them as cover. Then they become corporate camouflage, which is a lovely way to waste a lot of time. The trick is to compare like with like, or not compare at all.
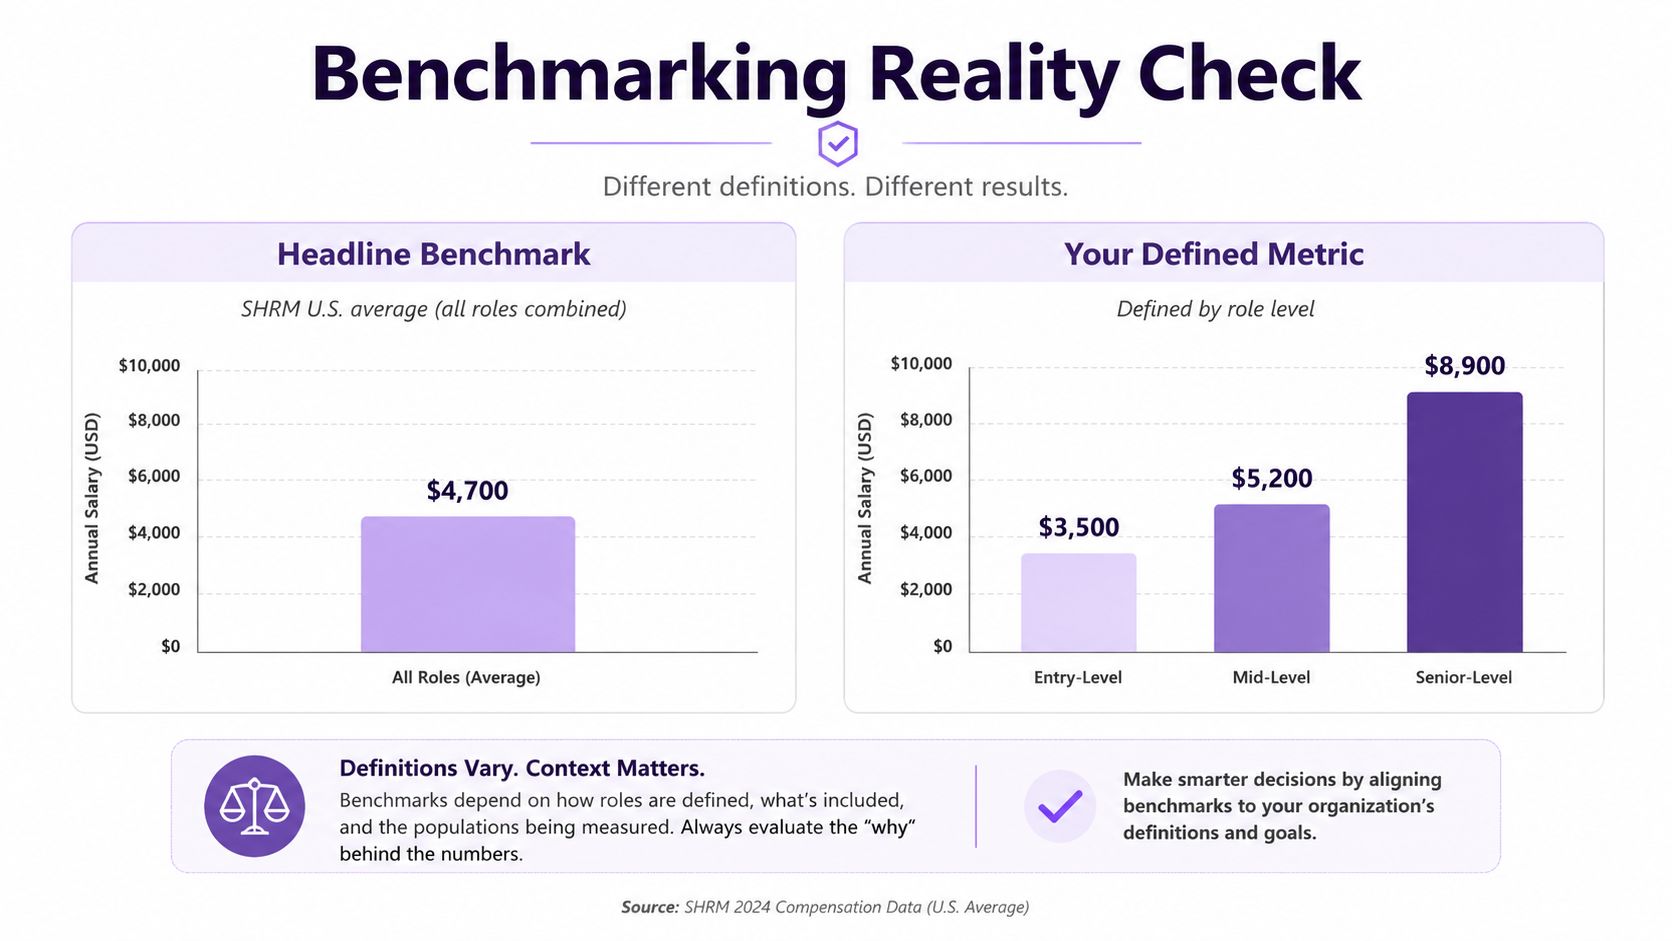
The $4,700 U.S. average from SHRM gets quoted because it's clean and easy to remember. Fine. But the minute you start comparing an executive search, a technical role, and a high-volume entry-level pipeline with that same number, you've left analysis and entered self-deception.
The role spread matters more than the headline. Executive positions cost a lot more than nonexecutive roles, and senior hiring routinely drags in more stakeholders, more interviews, and more labor. If your team is hiring specialist talent, your internal benchmark should reflect the role mix, not someone else's org chart.
Quarterly is the practical sweet spot for cost per hire analysis. Monthly works when you're in a high-volume push or testing sourcing channels, annual smooths seasonality, and quarterly gives you enough data to spot drift without waiting a full year to realize you've been overspending. The point isn't ritual. It's trend detection.
Benchmark like a scientist. Match definition, time window, and role mix, or don't benchmark.
That's why role-level benchmarking matters more than a vanity average. A low CPH in a role that produces bad hires is not a win, it's a future replacement cost wearing sunglasses. A high CPH in a scarce role may be the better economic choice if it gets the seat filled faster and with less downstream drama.
Most advice on lowering hiring cost is just scope manipulation in a nicer suit. People remove onboarding, stop counting hiring-manager time, or ignore vacancy loss, then declare victory. That doesn't save money, it just shuffles it into a different bucket and calls it strategy.
Start with the channel mix. Kill the sources that produce high cost per hire and weak downstream quality, especially when they keep flooding the funnel with applicants nobody wants to interview. Then look at assessment design. Three clunky rounds are not a virtue, they're a labor tax with a calendar reminder.
Pipeline nurturing is another real lever. If you build and maintain warm candidate pools, you stop paying to start from zero every time a role opens. That's the boring part of recruiting that pays off, which is probably why so many teams prefer to talk about branding slides instead.
Remove admin from recruiters' days. Manual triage, note cleanup, and scheduling churn eat hours that should go into candidate conversations and closing. If you save time but add another tool that nobody uses, you've just bought another subscription and called it progress.
One option in this space is LatHire, an AI-powered hiring platform that connects US and Canadian companies with pre-vetted Latin American professionals, and it combines sourcing, vetting, HR, payroll, benefits, and legal compliance in one workflow. It also says it cuts hiring costs by up to 80% and time-to-hire by over 80% by using a pre-vetted talent pool, which is useful when cross-border hiring is part of the plan and agency markup is the thing inflating your cost stack. If your roles are strictly local and timezone overlap doesn't matter, it may not be the right lever, and that's fine.
My rule: if the fix doesn't reduce labor, reduce friction, or improve conversion quality, it's probably just a new label on the same bill.
If your real problem is retention rather than sourcing, the smarter move may be to cut turnover costs for SMEs, because replacing people repeatedly is a beautiful way to keep paying the same hiring tax forever. Hire better, retain longer, stop donating money to churn.
A quarterly review is not a ritual. It is a fast audit. Give one owner ninety minutes, pull the numbers, and cut off the usual escape hatch of “we need more time.” The point is to find the few variances that matter and force a decision before the quarter becomes another excuse.
Start with finance. Pull internal and external recruiting costs, then refresh cost per hire by channel and by role family. Compare the quarter to the one before it, then compare both against the benchmark you chose for a reason. Skip vanity comparisons. The job is to expose the two biggest variances, not to admire the dashboard.
Then assign one experiment to each variance. If a channel is too expensive, test a lower-cost sourcing path. If a role family is bloated, tighten the intake brief or simplify the assessment flow. If recruiter labor is the problem, trace the admin hours, because they are usually buried in scheduling, follow-up, and cleanup.
Role-level review matters because a cheap hire in one job family can hide expensive failure in another. For revenue roles, you need to know whether hiring cost lines up with actual output, not just closed requisitions. A useful companion is how to assess sales candidates, because screening quality only matters if the people you hire stay and perform.
Keep the dashboard small enough that people will read it.
Quarterly is the right cadence because the definition stays fixed and the period stays fixed. That makes trend reads cleaner and keeps seasonal noise from masquerading as a hiring problem. Pin's benchmarking guidance makes the same point, and it is the kind of discipline that separates real analysis from budget theater.
Do not drag the same $4,700 figure from one review to the next and pretend it says something new. If the scope changed, the mix changed, or the channel strategy changed, that number is not a clean comparison. Normalize the inputs first, then judge the result. Otherwise you are benchmarking noise and calling it insight.
If the first quarter looks ugly, good. Ugly numbers tell the truth faster than polished dashboards do. Start measuring before you start optimizing, then make one clean change at a time.